Discussion Document 10
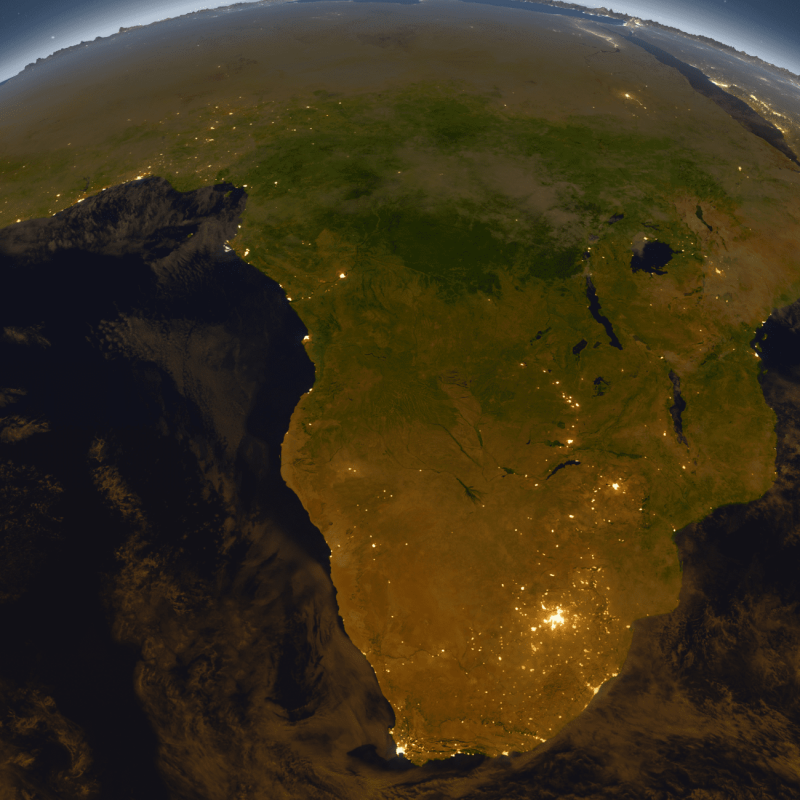
As novel types of data are becoming available, they can be incorporated into tracking economies’ progress towards achieving their goals. This paper provides an in-depth analysis on how nighttime light data can be used to analyse the dynamics of economic activity in South Africa. These lights leave a footprint of human activity on the Earth’s surface which can be mapped with census data to determine how the urban extent develops, whether the level of urbanisation grows, and how this is related to changes in socio-economic indicators such as poverty, inequality and access to electricity.
- What does luminosity data reveal about the extent to which an area is rural or urban?
- How can luminosity data be used to better understand how the level of urbanisation in South Africa has grown?
- What can luminosity data teach us about poverty, inequality and access to electricity?
- What is the relationship between South African census data from 1996 to 2011 and areas lit with night lights?
- Is urban, as defined in the census, reflective of nighttime lights and infrastructure?
- What are the challenges of using luminosity data to understand socio-economic indicators in South Africa?
This research employs sophisticated modelling techniques which provide insights as to how and when luminosity data can be or cannot be used to inform policy effectiveness.


